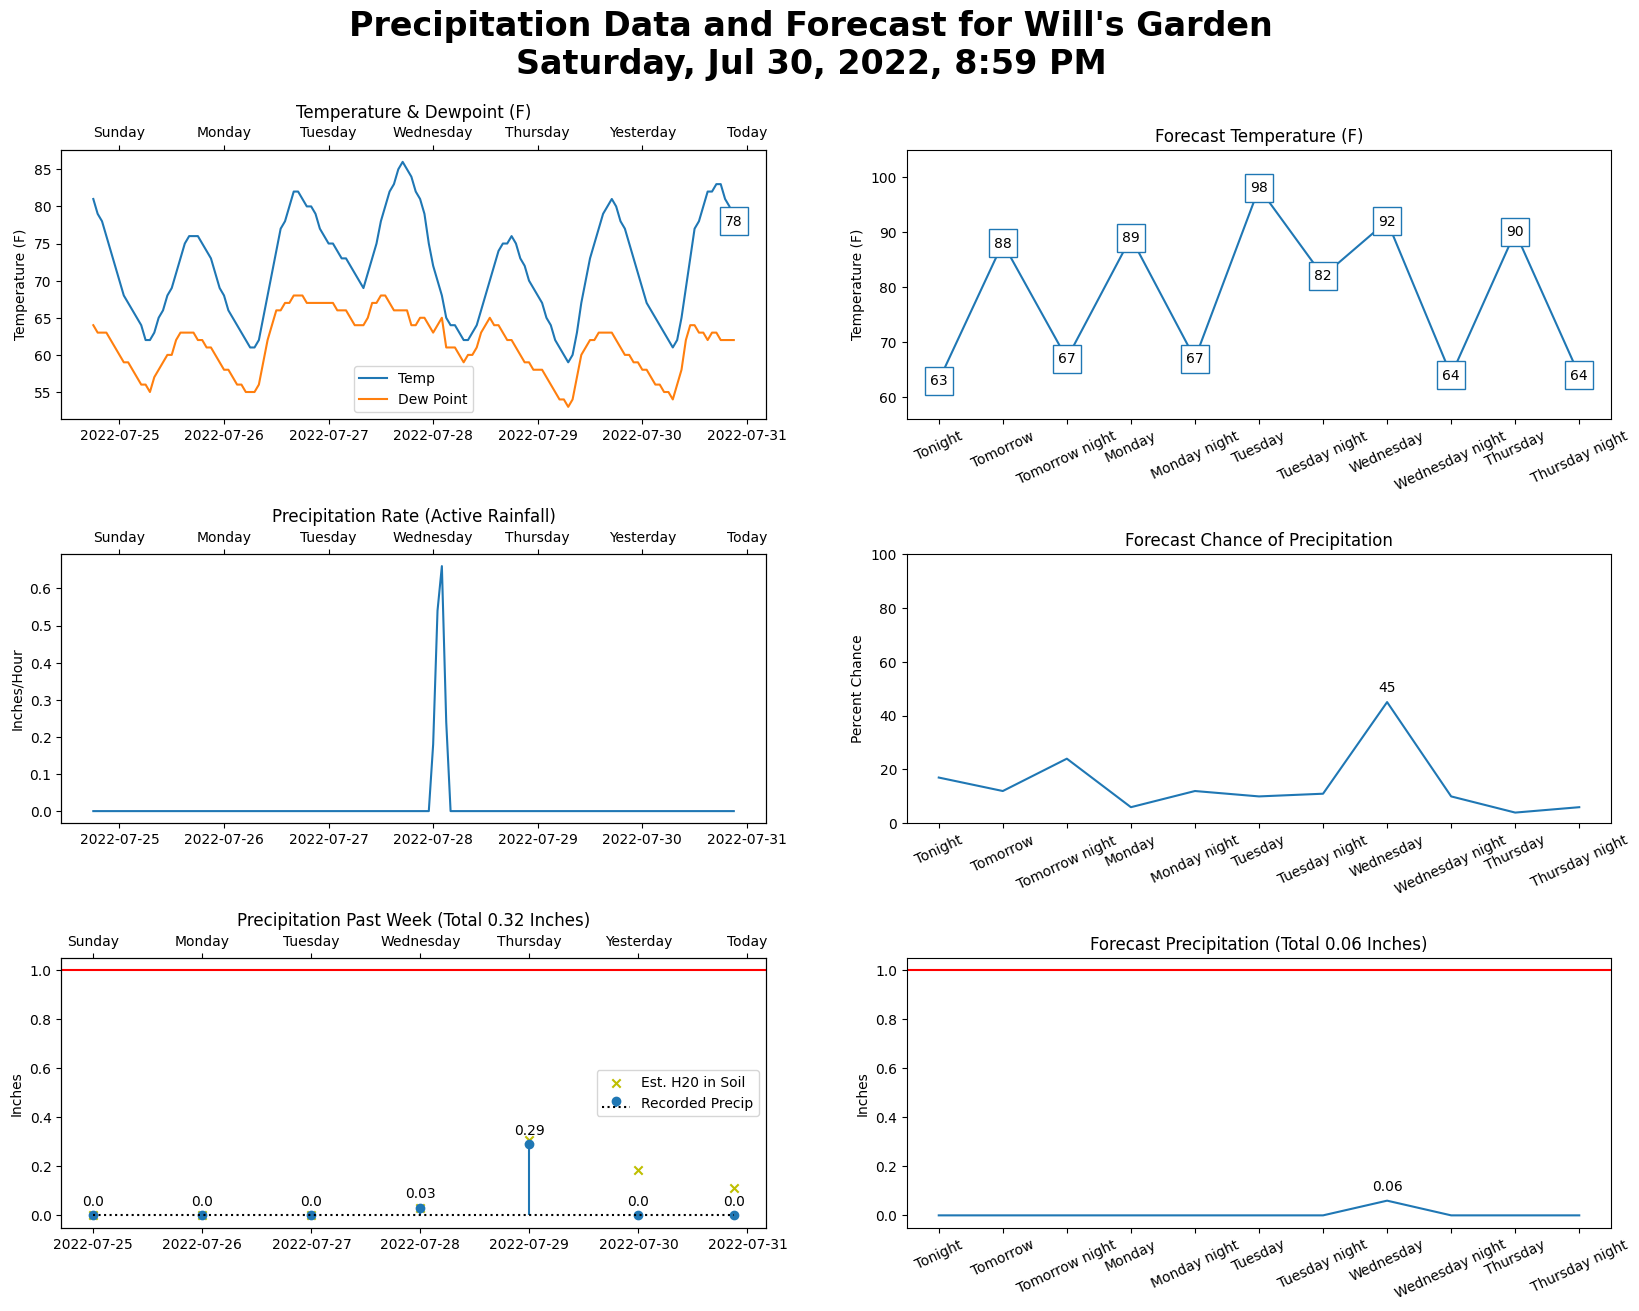
Garden Precipitation Dashboard
Python, AWS Lambda, Amazon API Gateway, Weather Underground API, Personal Weather Station
This is a personal dashboard I built to display weather data from my personal weather station, plus the temperature and rain forecast. I use this throughout the week to plan my gardening, watering, and lawncare activities.
See Current Dashboard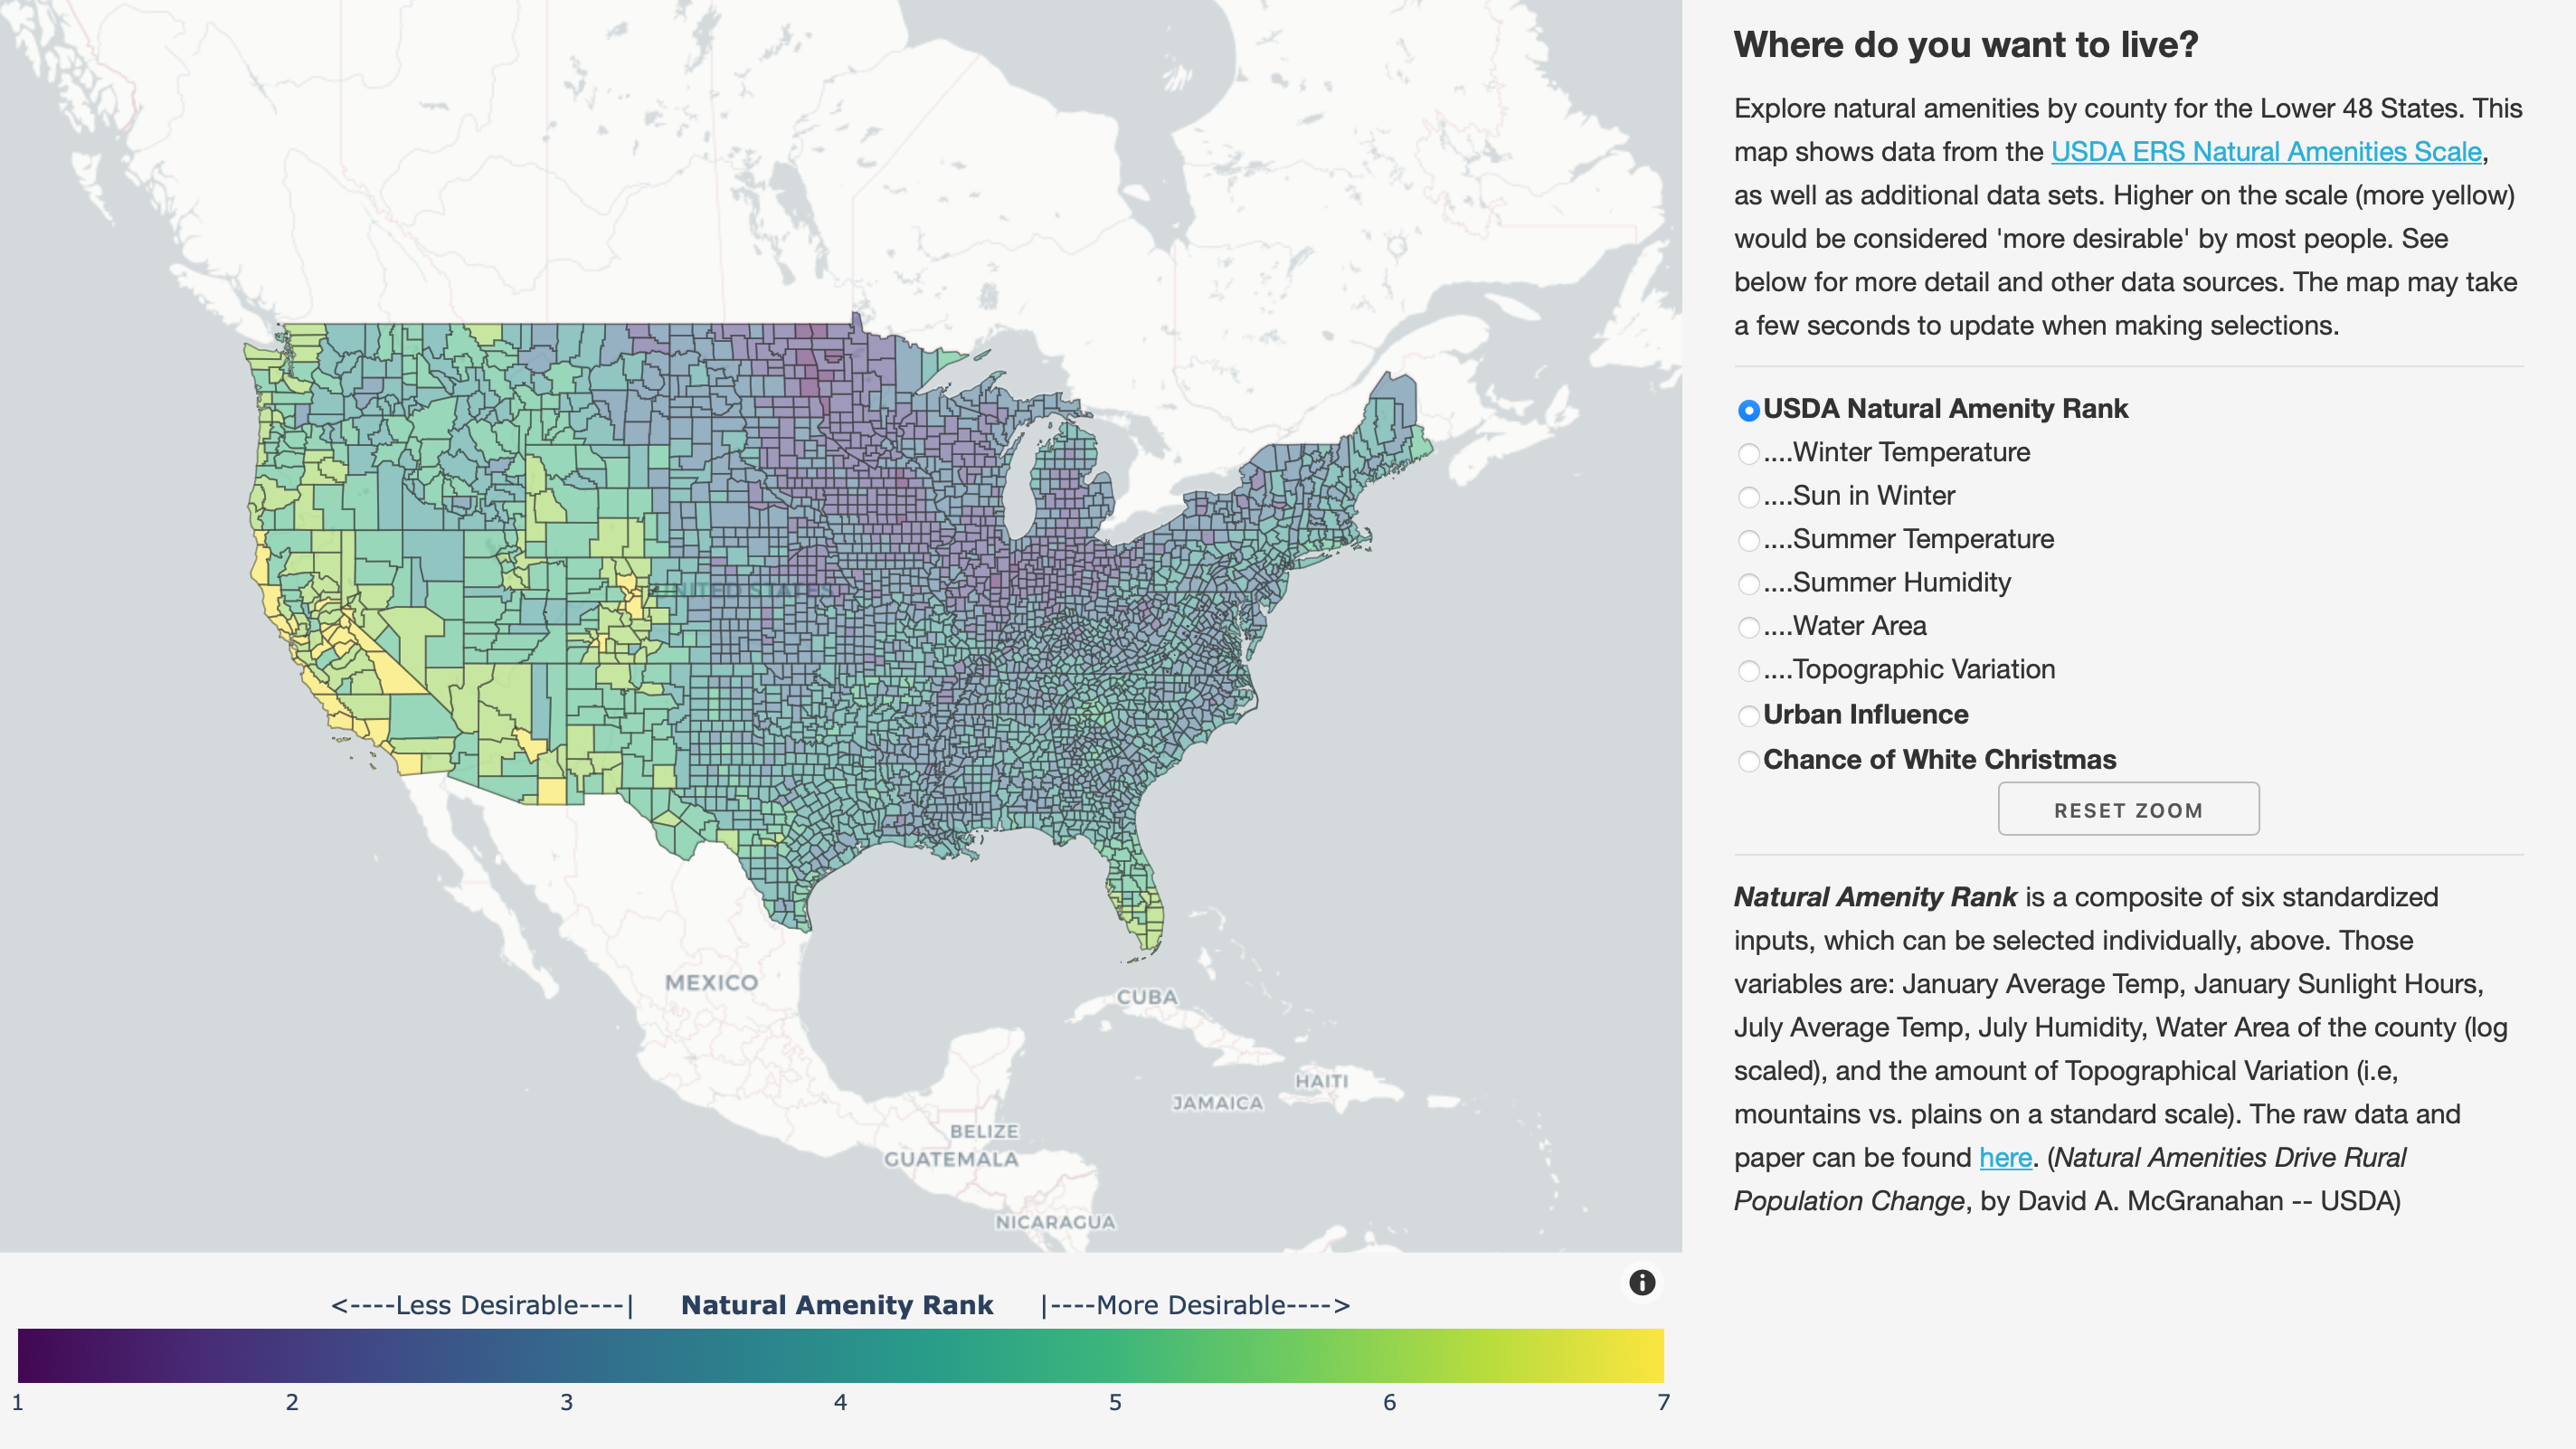
Interactive Natural Amenities Map
Python, Plotly/Dash, AWS Elastic Beanstalk, and a touch of awk for initial data processing
This is an interactive map showing various “natural amenities” by county for the contiguous United States. The displayed variables include enviromental factors that can influence one's enjoyment of living in a location, such as the number of sunny days in winter, summer humidity levels, or topographical variation (i.e., plains or mountains).
View Interactive Map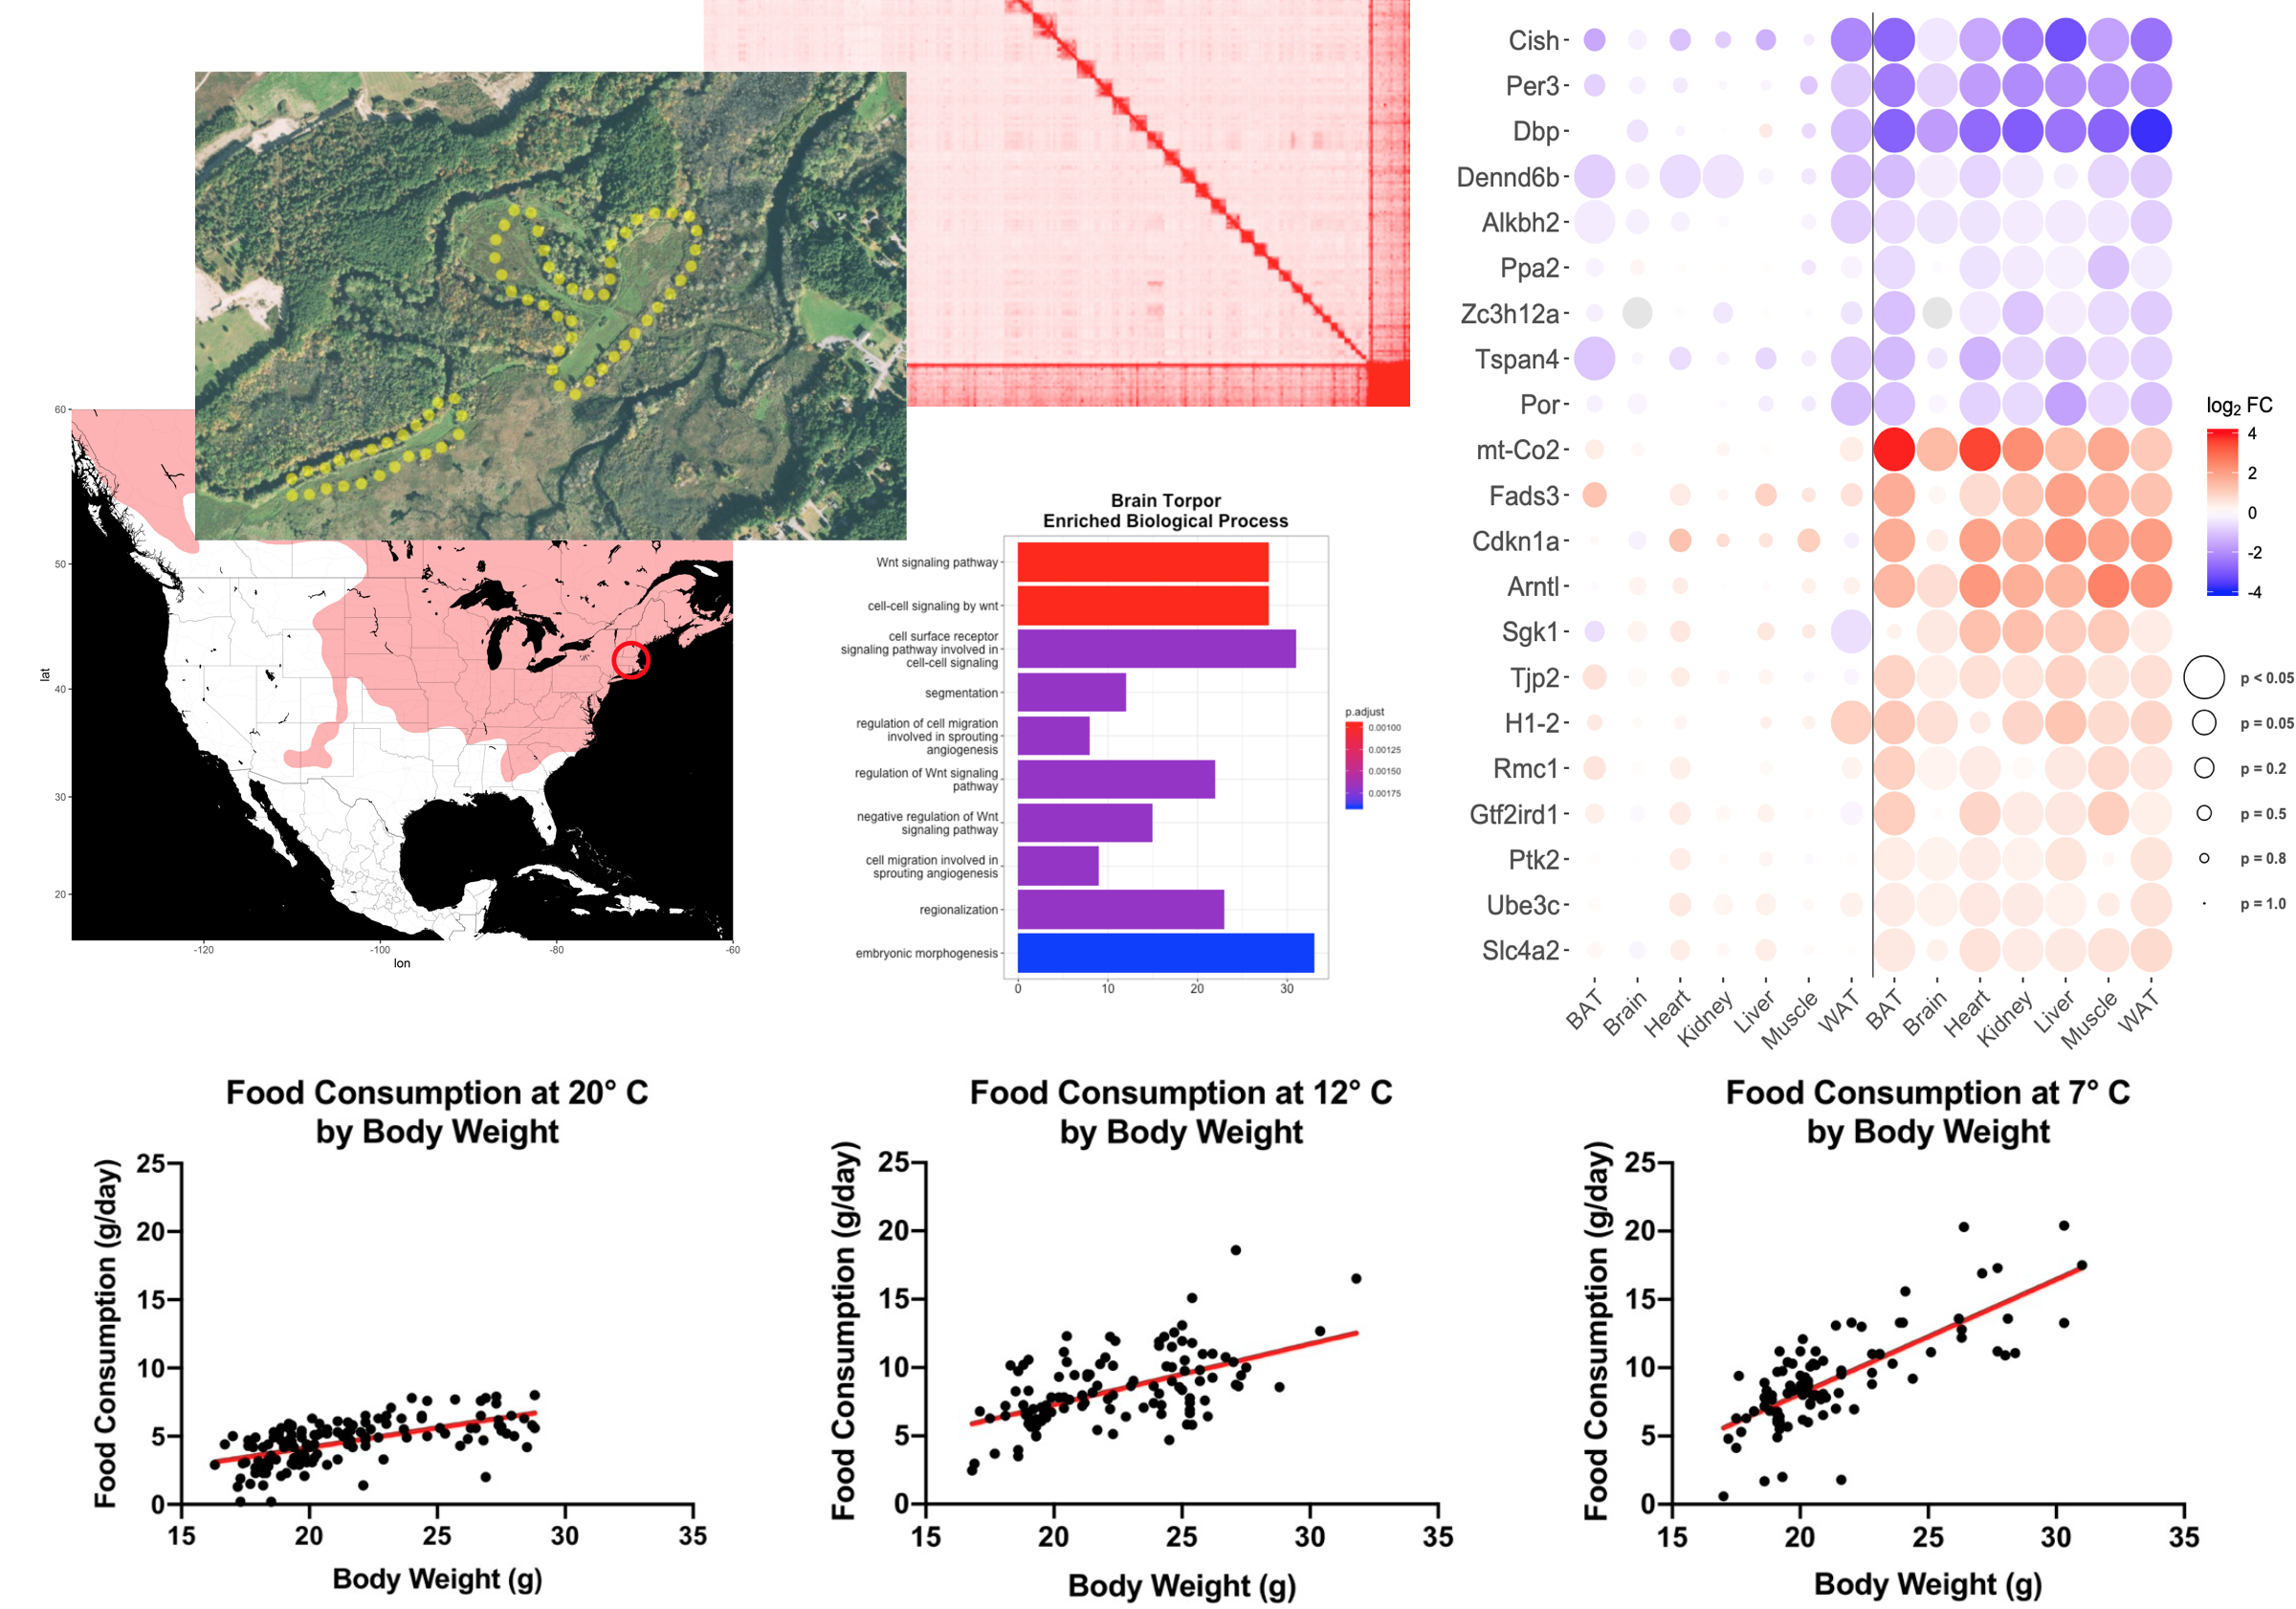
Bioinformatics, Data Analysis & Visualization
R, bash, awk, HPC @ TACC
I have experience working at the command line to successfully perform genome assembly, gene expression analysis, multiple regression, statistical analysis, data visualization, and map generation using R and awk scripts, data analysis pipelines, and assembly tools. I am also skilled at using various non-coding tools for analysis, statistics, and data visualization, including GraphPad Prism, Excel, and Adobe Illustrator/Photoshop.

Publications & Presentations
Peer Reviewed Scientific Publications, Posters, and Invited Talks at Scientific Conferences
I have extensive experience conceiving, designing, executing, and reporting life science research to a variety of audiences in written, oral, and visual formats. I enjoying thinking rigorously about the methods and logic required to answer interesting questions.