Will’s Garden Precipitation Dashboard
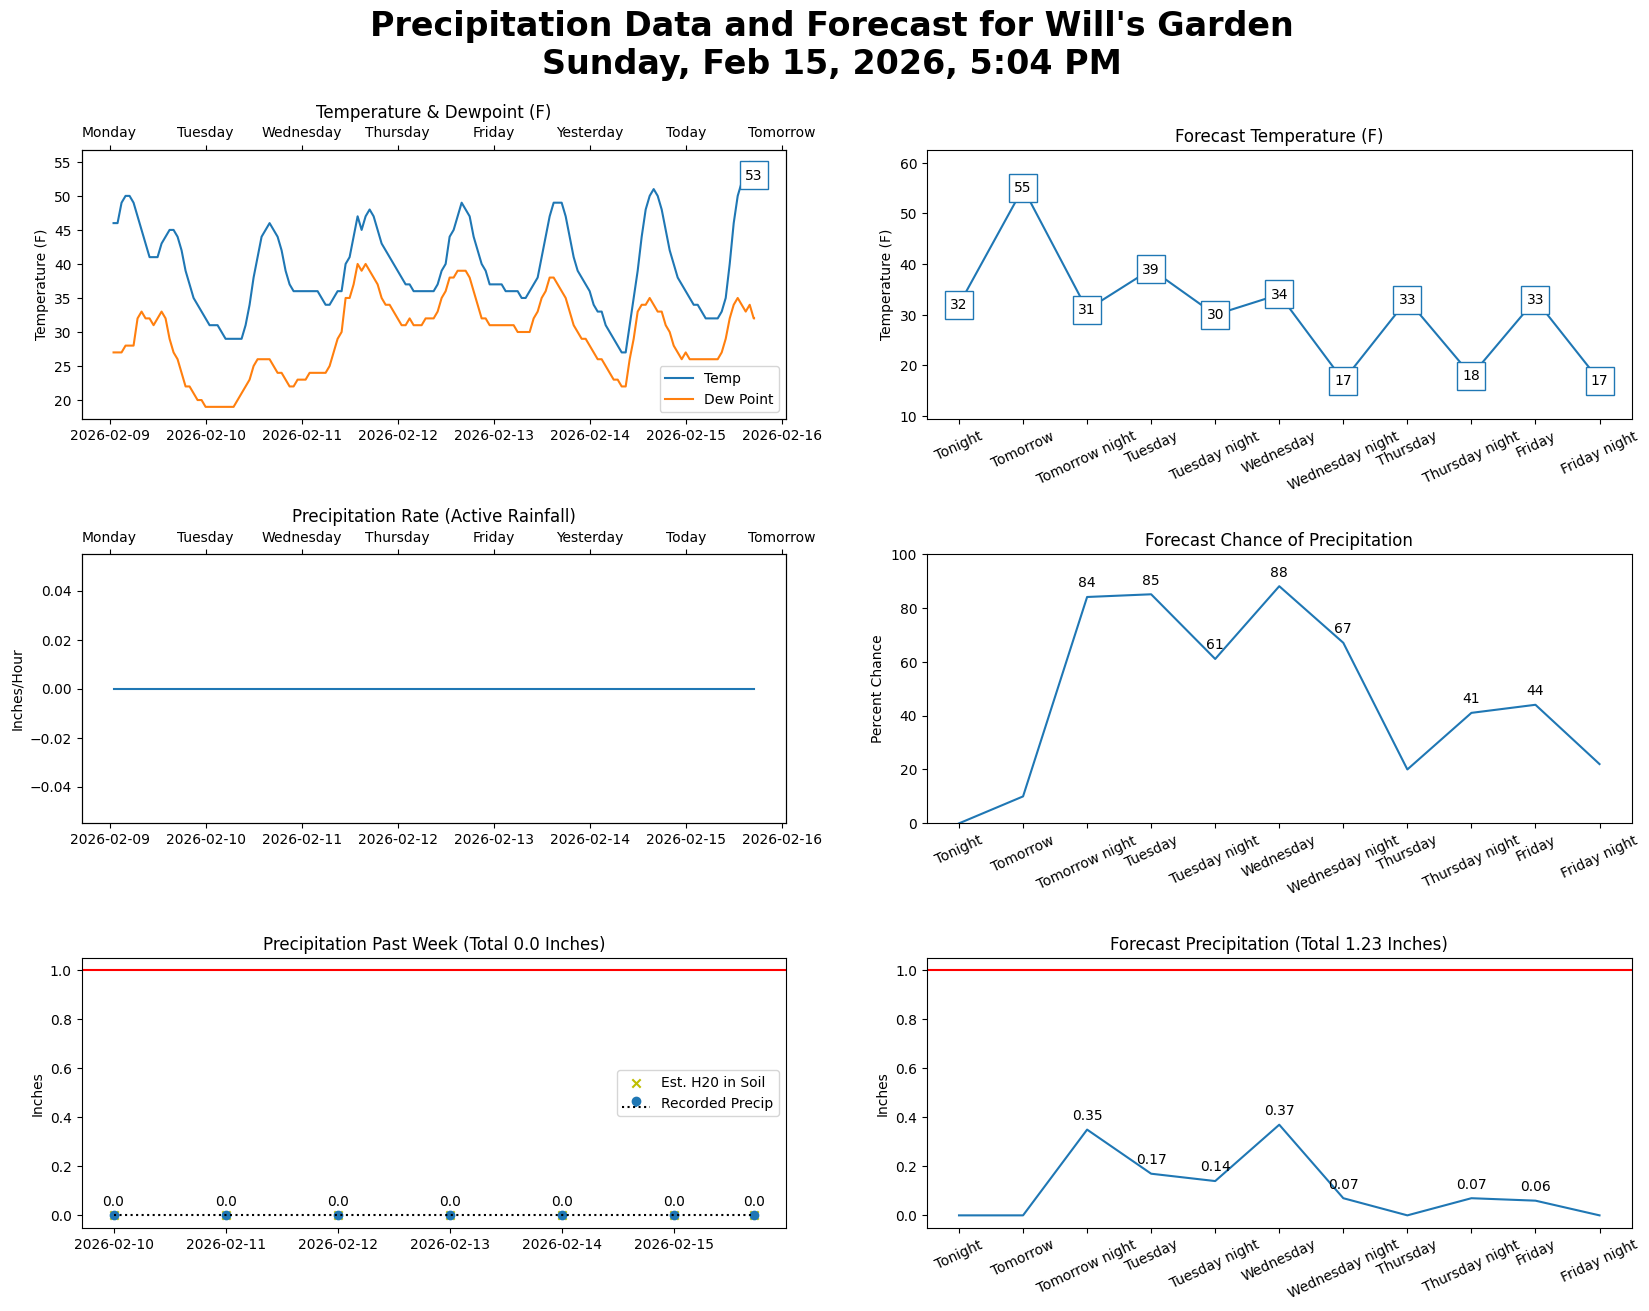
What it is: This is a utilitarian ‘dashboard' that I use to keep track of past and expected rainfall to help me know when I need to water my garden. My target is 1+ inches of water on the garden per week (the red line on the bottom two plots). The rainfall here is quite variable, so these data help me avoid under- or over-irrigating.
How it works: I have a personal weather station (KIAAMES93) that sends data to Weather Underground. I use a Python script to retrieve my weather data and forecast data using the Weather Underground API. The script then processes and plots the weather data that I want to see, in a way that is not available otherwise. The script runs on AWS Lambda and is accessed through the Amazon API Gateway.
More info:
Direct Link to the plot via the API.
See the project on GitHub.
[Refresh to update.]
Loading...
...may take 3-5 seconds...
